m4HouseStation v0.1
m4HouseStation is a device for monitoring the power and gas consumption in the house I currently live in.
Why?
I very much like statistics in general, but once winter began and our gas/electricity bills started to rise to a level where everyone involved was starting to notice and getting annoyed by it, I wanted to know more about when and what is using this much energy. I didn’t do anything about it at that point, but a couple of months later when I started to get into micro controller programming again, I knew what kind of device I wanted to build. Something that would help me answer these questions.
The end product that is running stable for about a month now, is a device that is functional and displays the power consumption of electricity and gas 24/7 accessible through the browser over a network connection.
Result / Features
Gas, Electricity, Temperature and Humidity are continuously logged 24/7, and are accessible trough the network via a Web browser in form of diagrams. For every day there is a different diagram that shows also the estimated cost of the gas and electricity for that day.
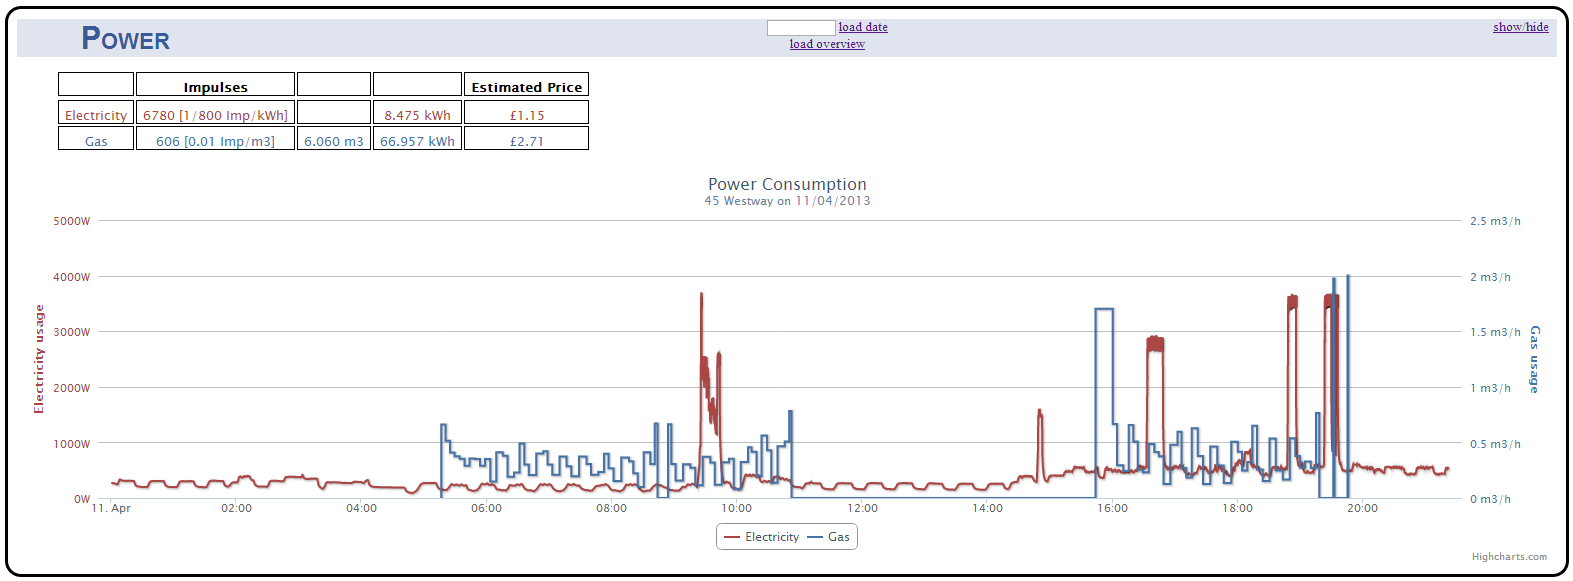 Gas & Electricity usage: day view
A similar diagram shows the usage over a longer time frame:
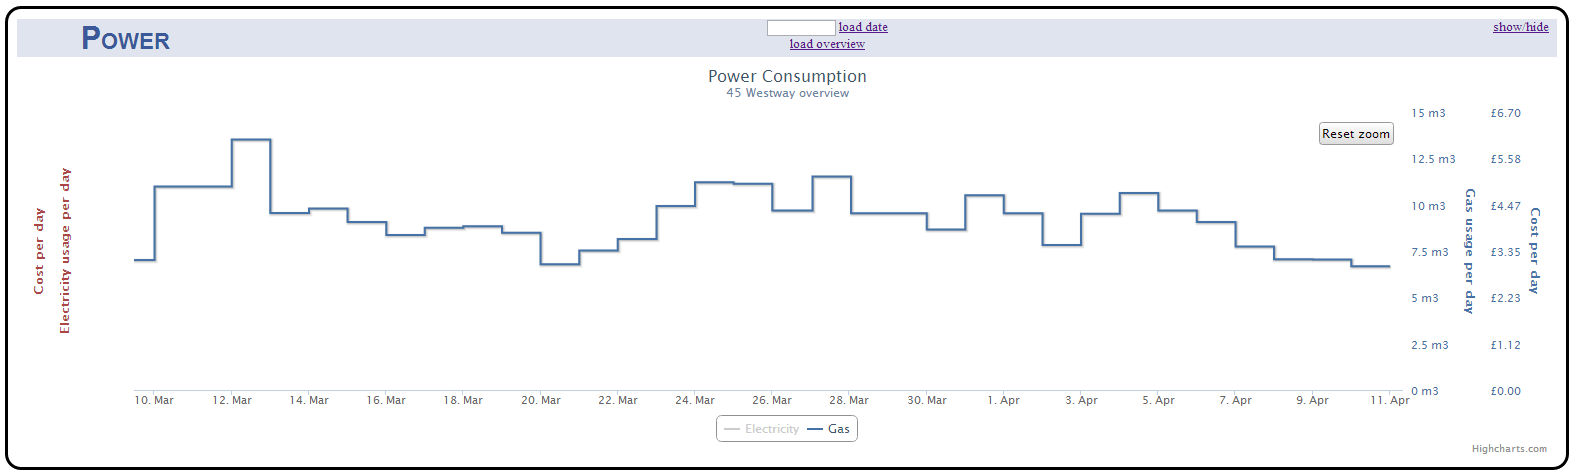 Overview Gas usage
Live data can be displayed in text form, and allows adjustment of the meter values if they don’t align with the real meters. This can happen when there is no power to the device for a moment, or the sensors are disturbed.
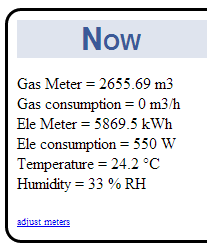
Live data
How does it work?
The meters in our house are providing pulses for certain amounts of power consumed. In the case of the electricity meter it is a LED that blinks, for every 0.00125 kWh that is consumed. A Photo-resistor which is fixed to the LED is detecting the level of the light. With a comparator, a clean pulse is generated when the light level is over a certain threshold.
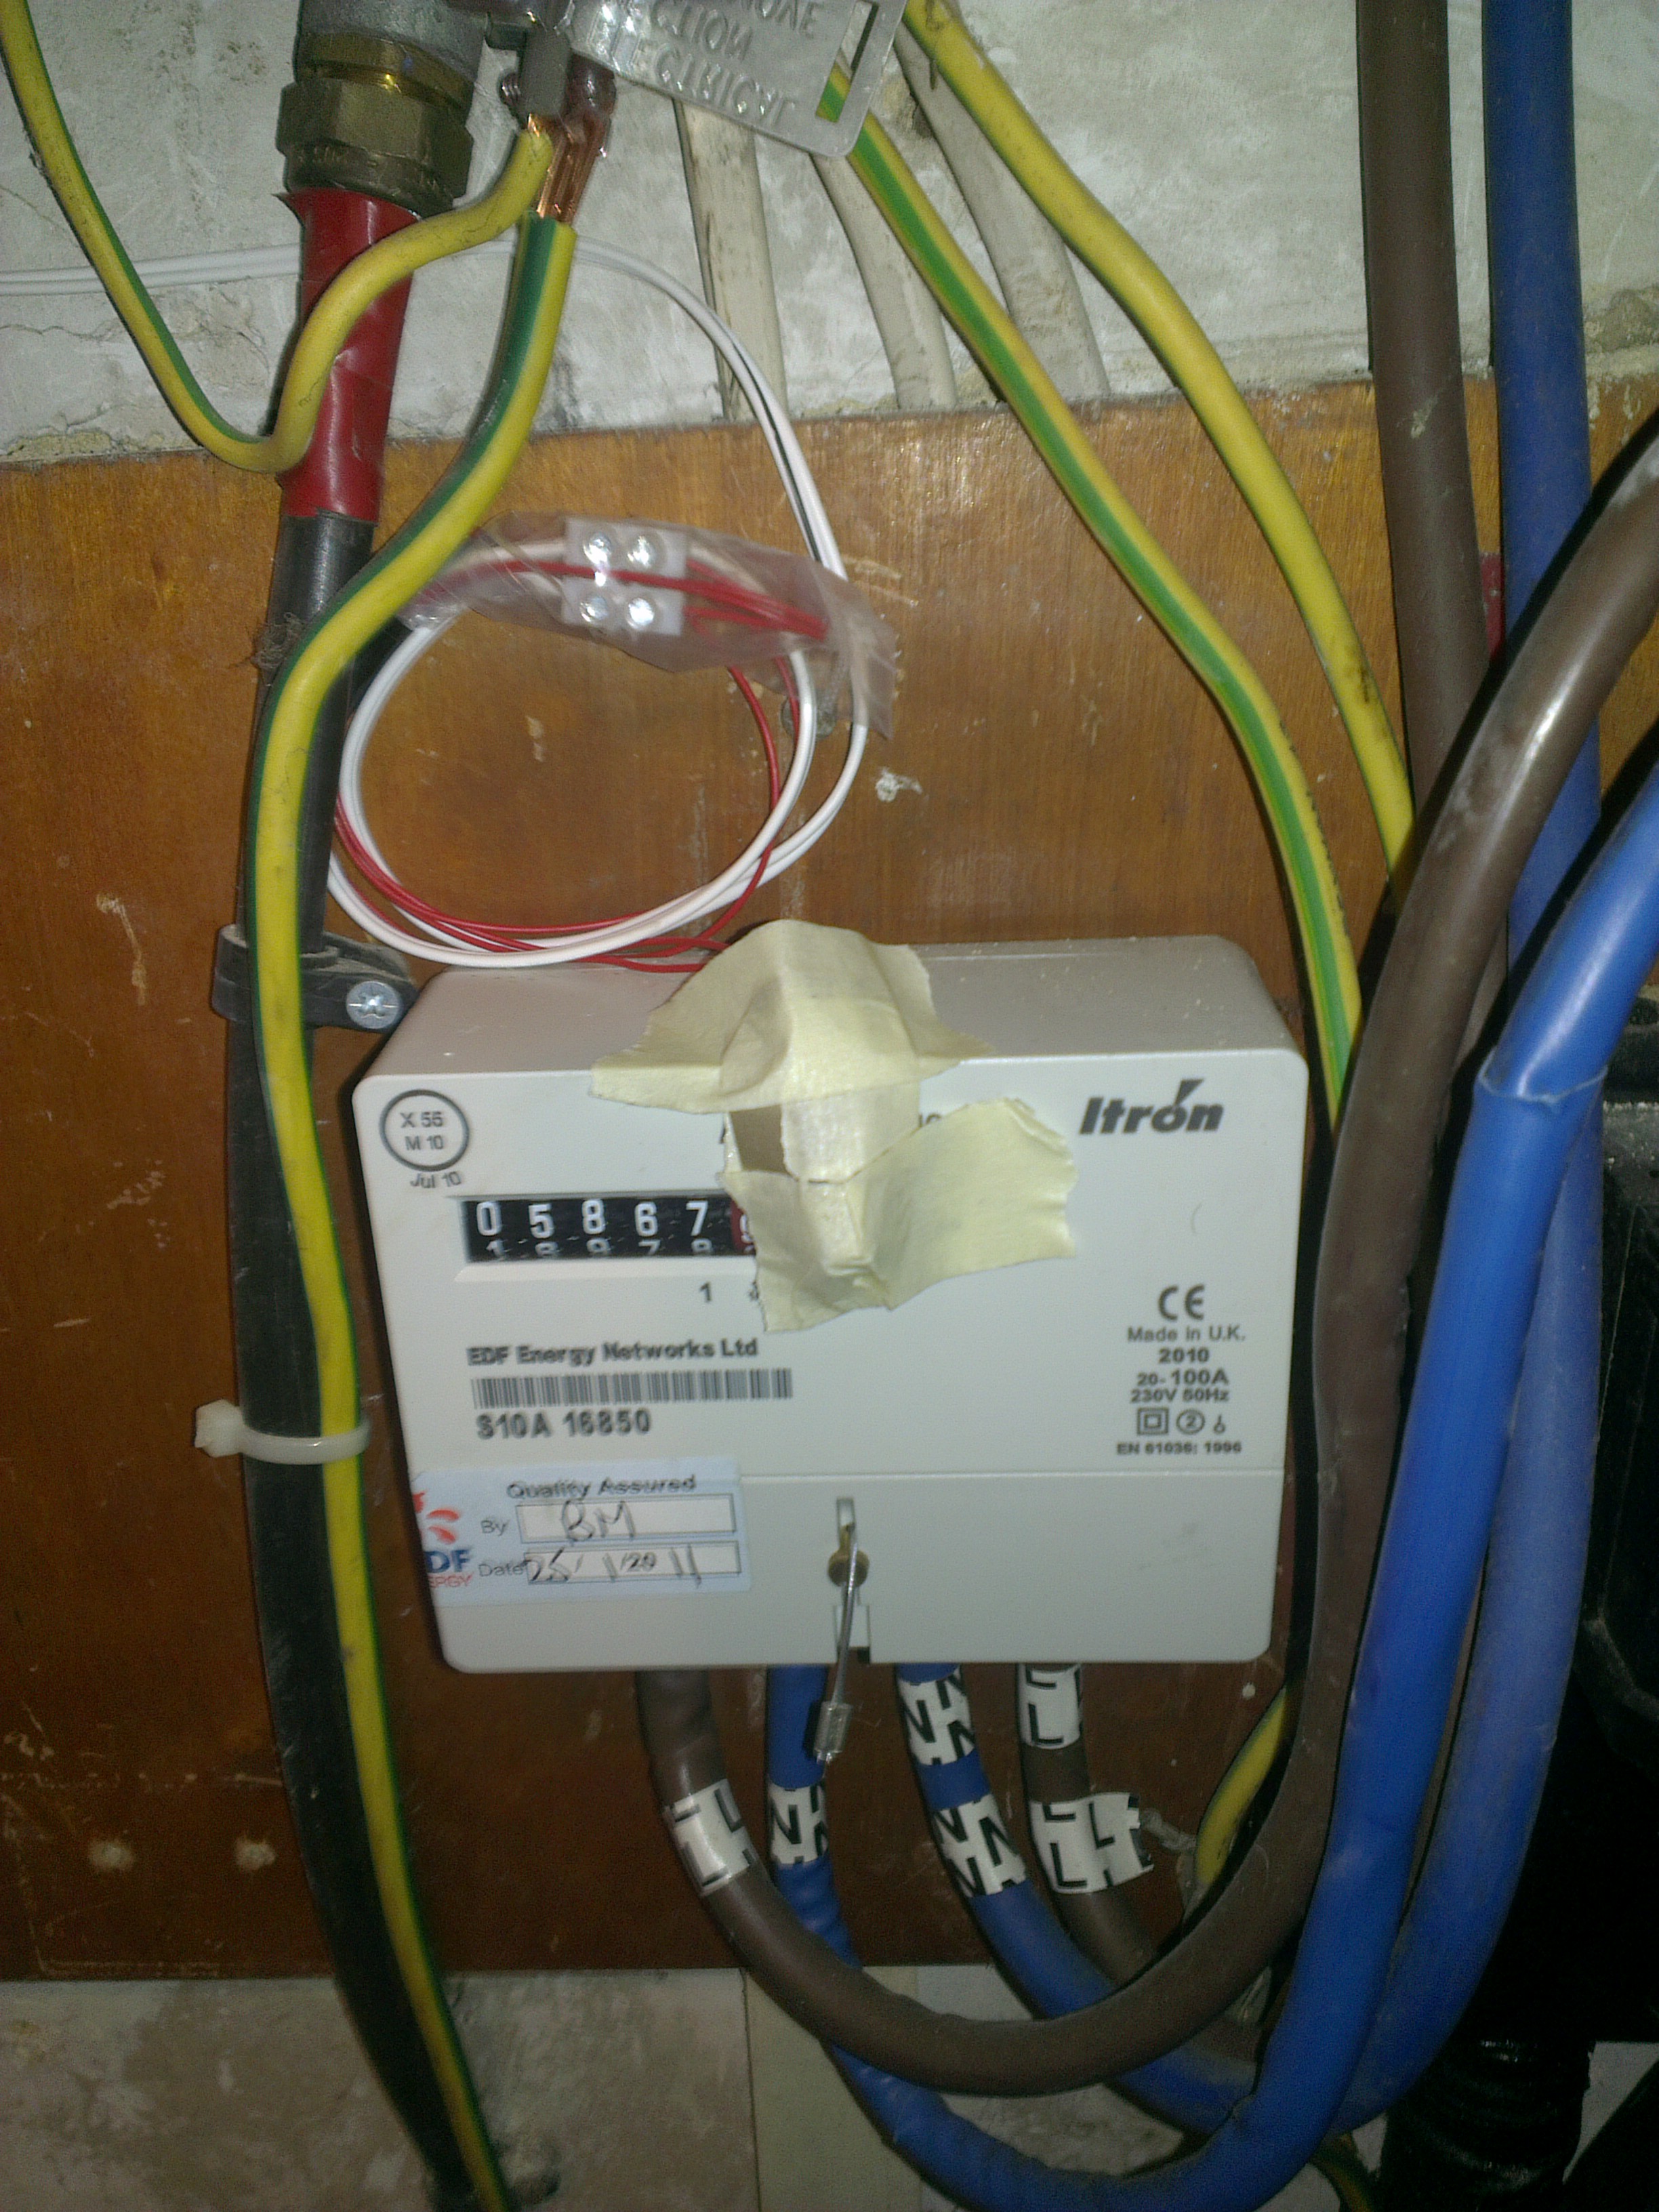
Meter pulse detection
In the case of the gas meter, a magnetic pulse is given out. This can be captured with a reed switch fixed in the right place on the casing. With the help of the official data sheet of the meter, this place was easy to find.
After a debouncing circuit, both these signals can be fed into the micro-controller which writes down every pulse with the right time stamp into a text file on the SD card. The time stamp is taken from a RTC chip, which keeps the time even when the power is lost.
On the micro-controller there is also a small Web server installed, through which all the information can be accessed. The computation of the diagrams is done locally on the web browser in java script This takes a lot of work away from the micro-controller.
Hardware
Don’t ask me why I used Arduino for this Project. There is no real reason except that it was the only development board available at the nearest electronics shop.
The core of the hardware is the Arduino Uno with an Ethernet shield, that fit together into an “Arduino Box”. In addition to that I made two small vero-boards, placed in the back of this box. These boards hold an RTC chip including a battery, and the analog circuits for the temperature and humidity sensors plus the stuff that is needed to detect the pulses.
Software
The source code is available on Github.
Limits / Future
The programming memory is used nearly 100%. During development I needed to change a couple of things, so everything could fit. That’s why there aren’t really a lot of things I can implement anymore, apart from the web interface, which only uses space on the SD card and bandwidth through the slow web server. So I think if I am able to get a few days of work behind it at some point, I will be able to finished the project.
Planned changes for v0.2
- make it configurable without needing to recompile and burn it to the micro-controller so it could be used by someone else in a different environment with different network settings and different meters.
- tidy up the web interface
- temperature and humidity outside the box, so they actually mean something.